Overview of the project
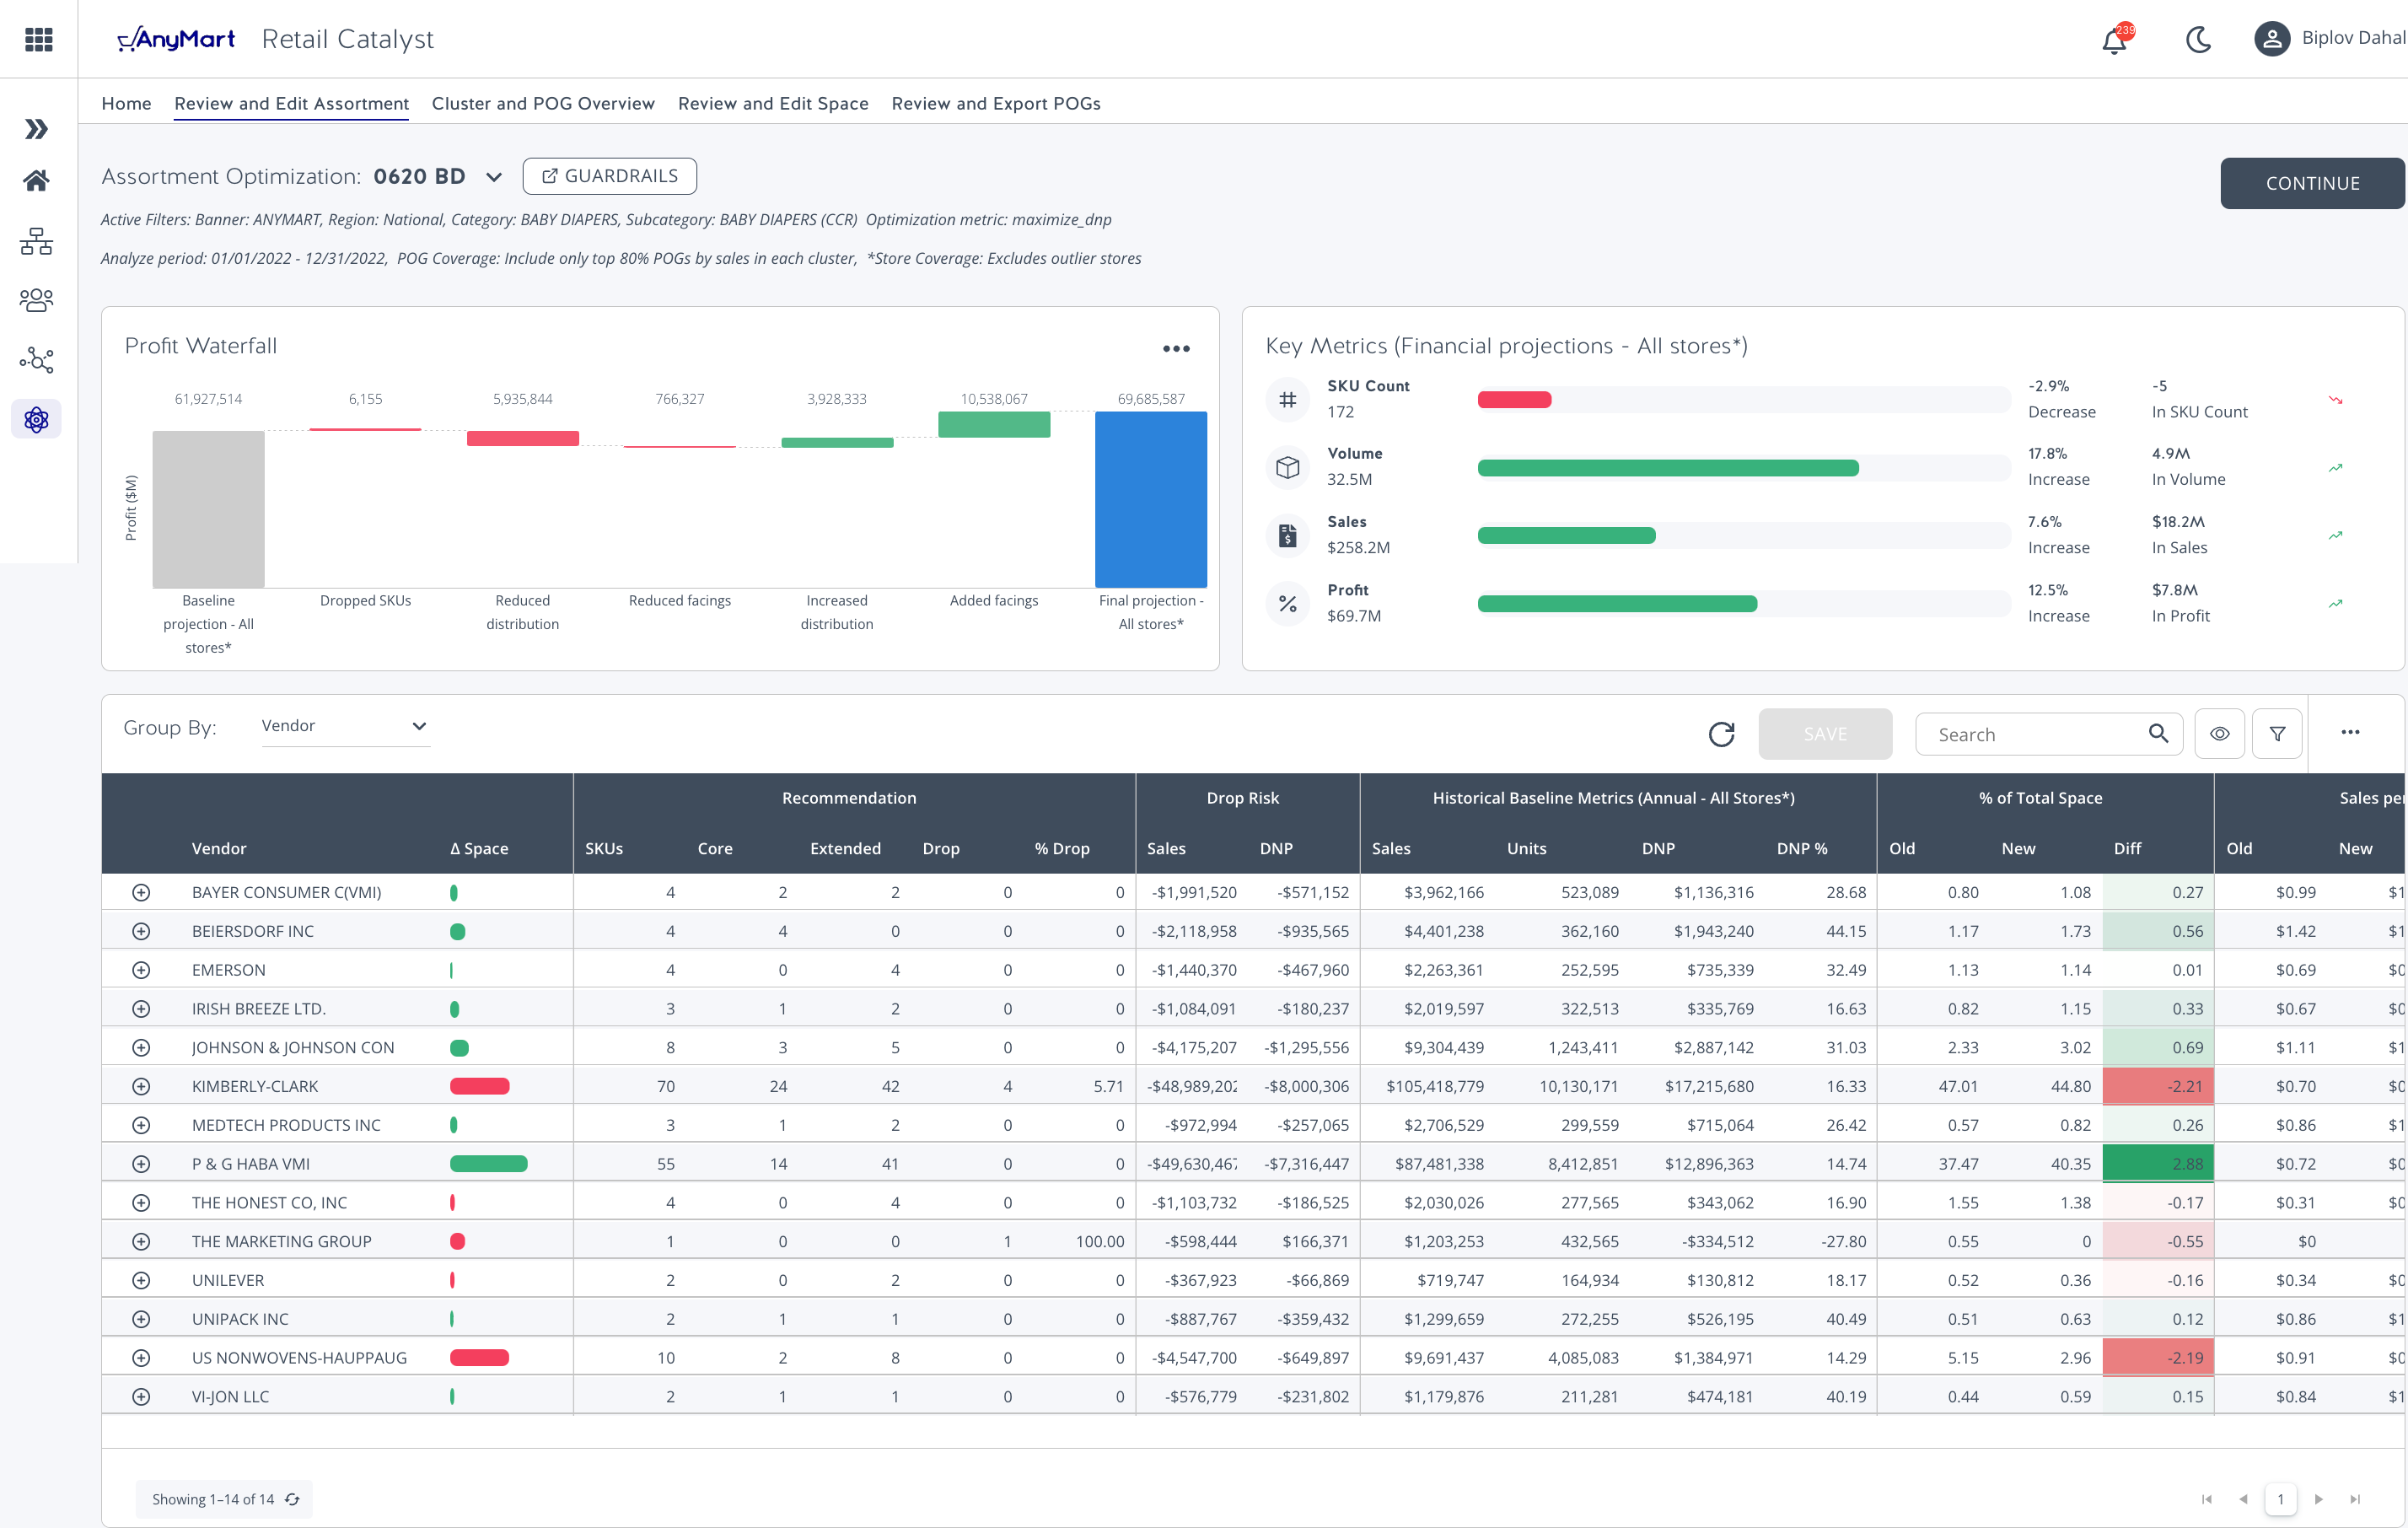
BCG recognized the need for an extraordinary solution, and they turned to me to create an innovative and advanced SaaS tool. Together, we embarked on a journey to empower category managers with the ability to strategically identify the perfect placement of items on the shelves. Through my expertise, I crafted an interactive and dynamic dashboard that allows them to adjust facings per shelf, while leveraging the power of cutting-edge data science algorithms. The result? An exhilarating and game-changing tool that delivers invaluable insights and propels their success to new heights.
After the initial engagement, my expertise in FastAPI and passion for utilizing cutting-edge technologies came into play. The BCG team entrusted me to lead the design and engineering efforts for their developer ecosystem, enabling continued development and growth. Recognizing my ability to revitalize legacy codebases and leverage the latest technologies like FastAPI, React, microservices architecture, and monorepository, I refactored their existing systems to unlock enhanced performance, scalability, and maintainability. This transformation paved the way for a seamless onboarding experience.
Process Evolution
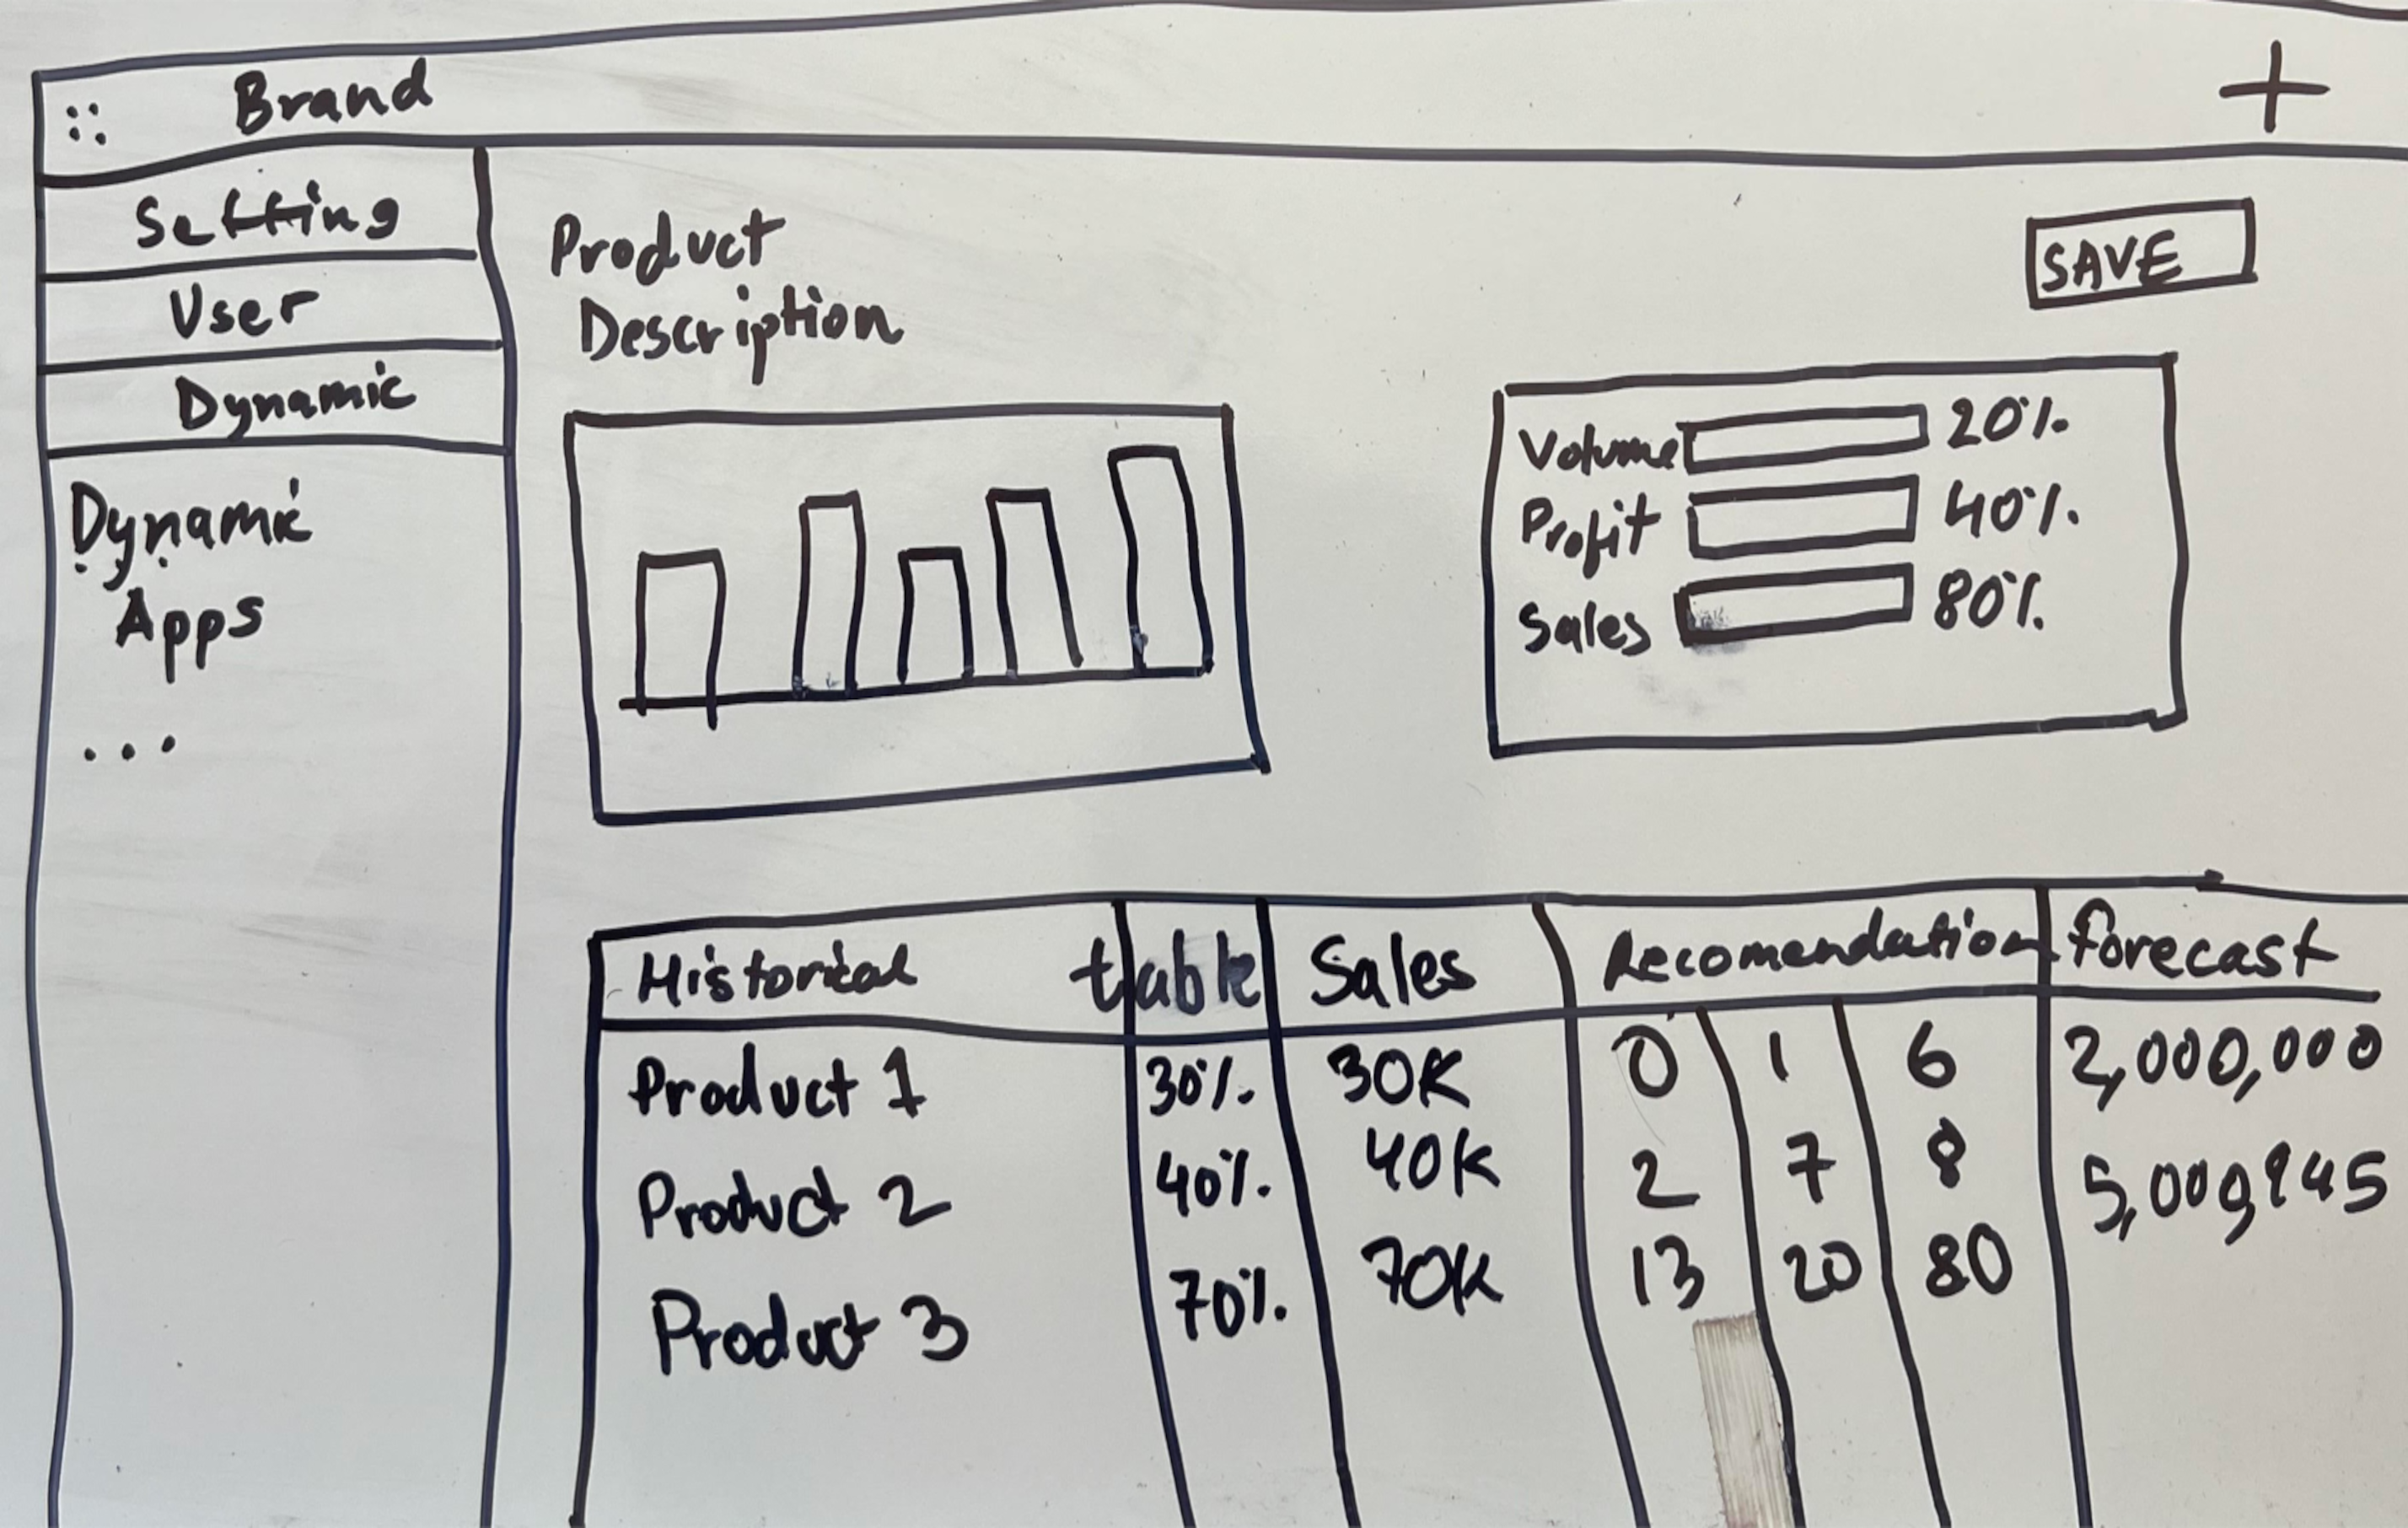
Rather than simply updating an old framework, I took a thoughtful and comprehensive approach to meet the product's needs from start to finish. Through a process of delivering quick yet considered sketches, I established an intellectual partnership with BCG. Together, we refined the product's features, making informed decisions that supported the final designs. The collaboration was dynamic and exciting, with a focus on creating an exceptional solution that surpassed expectations.
Advocacy for right tools
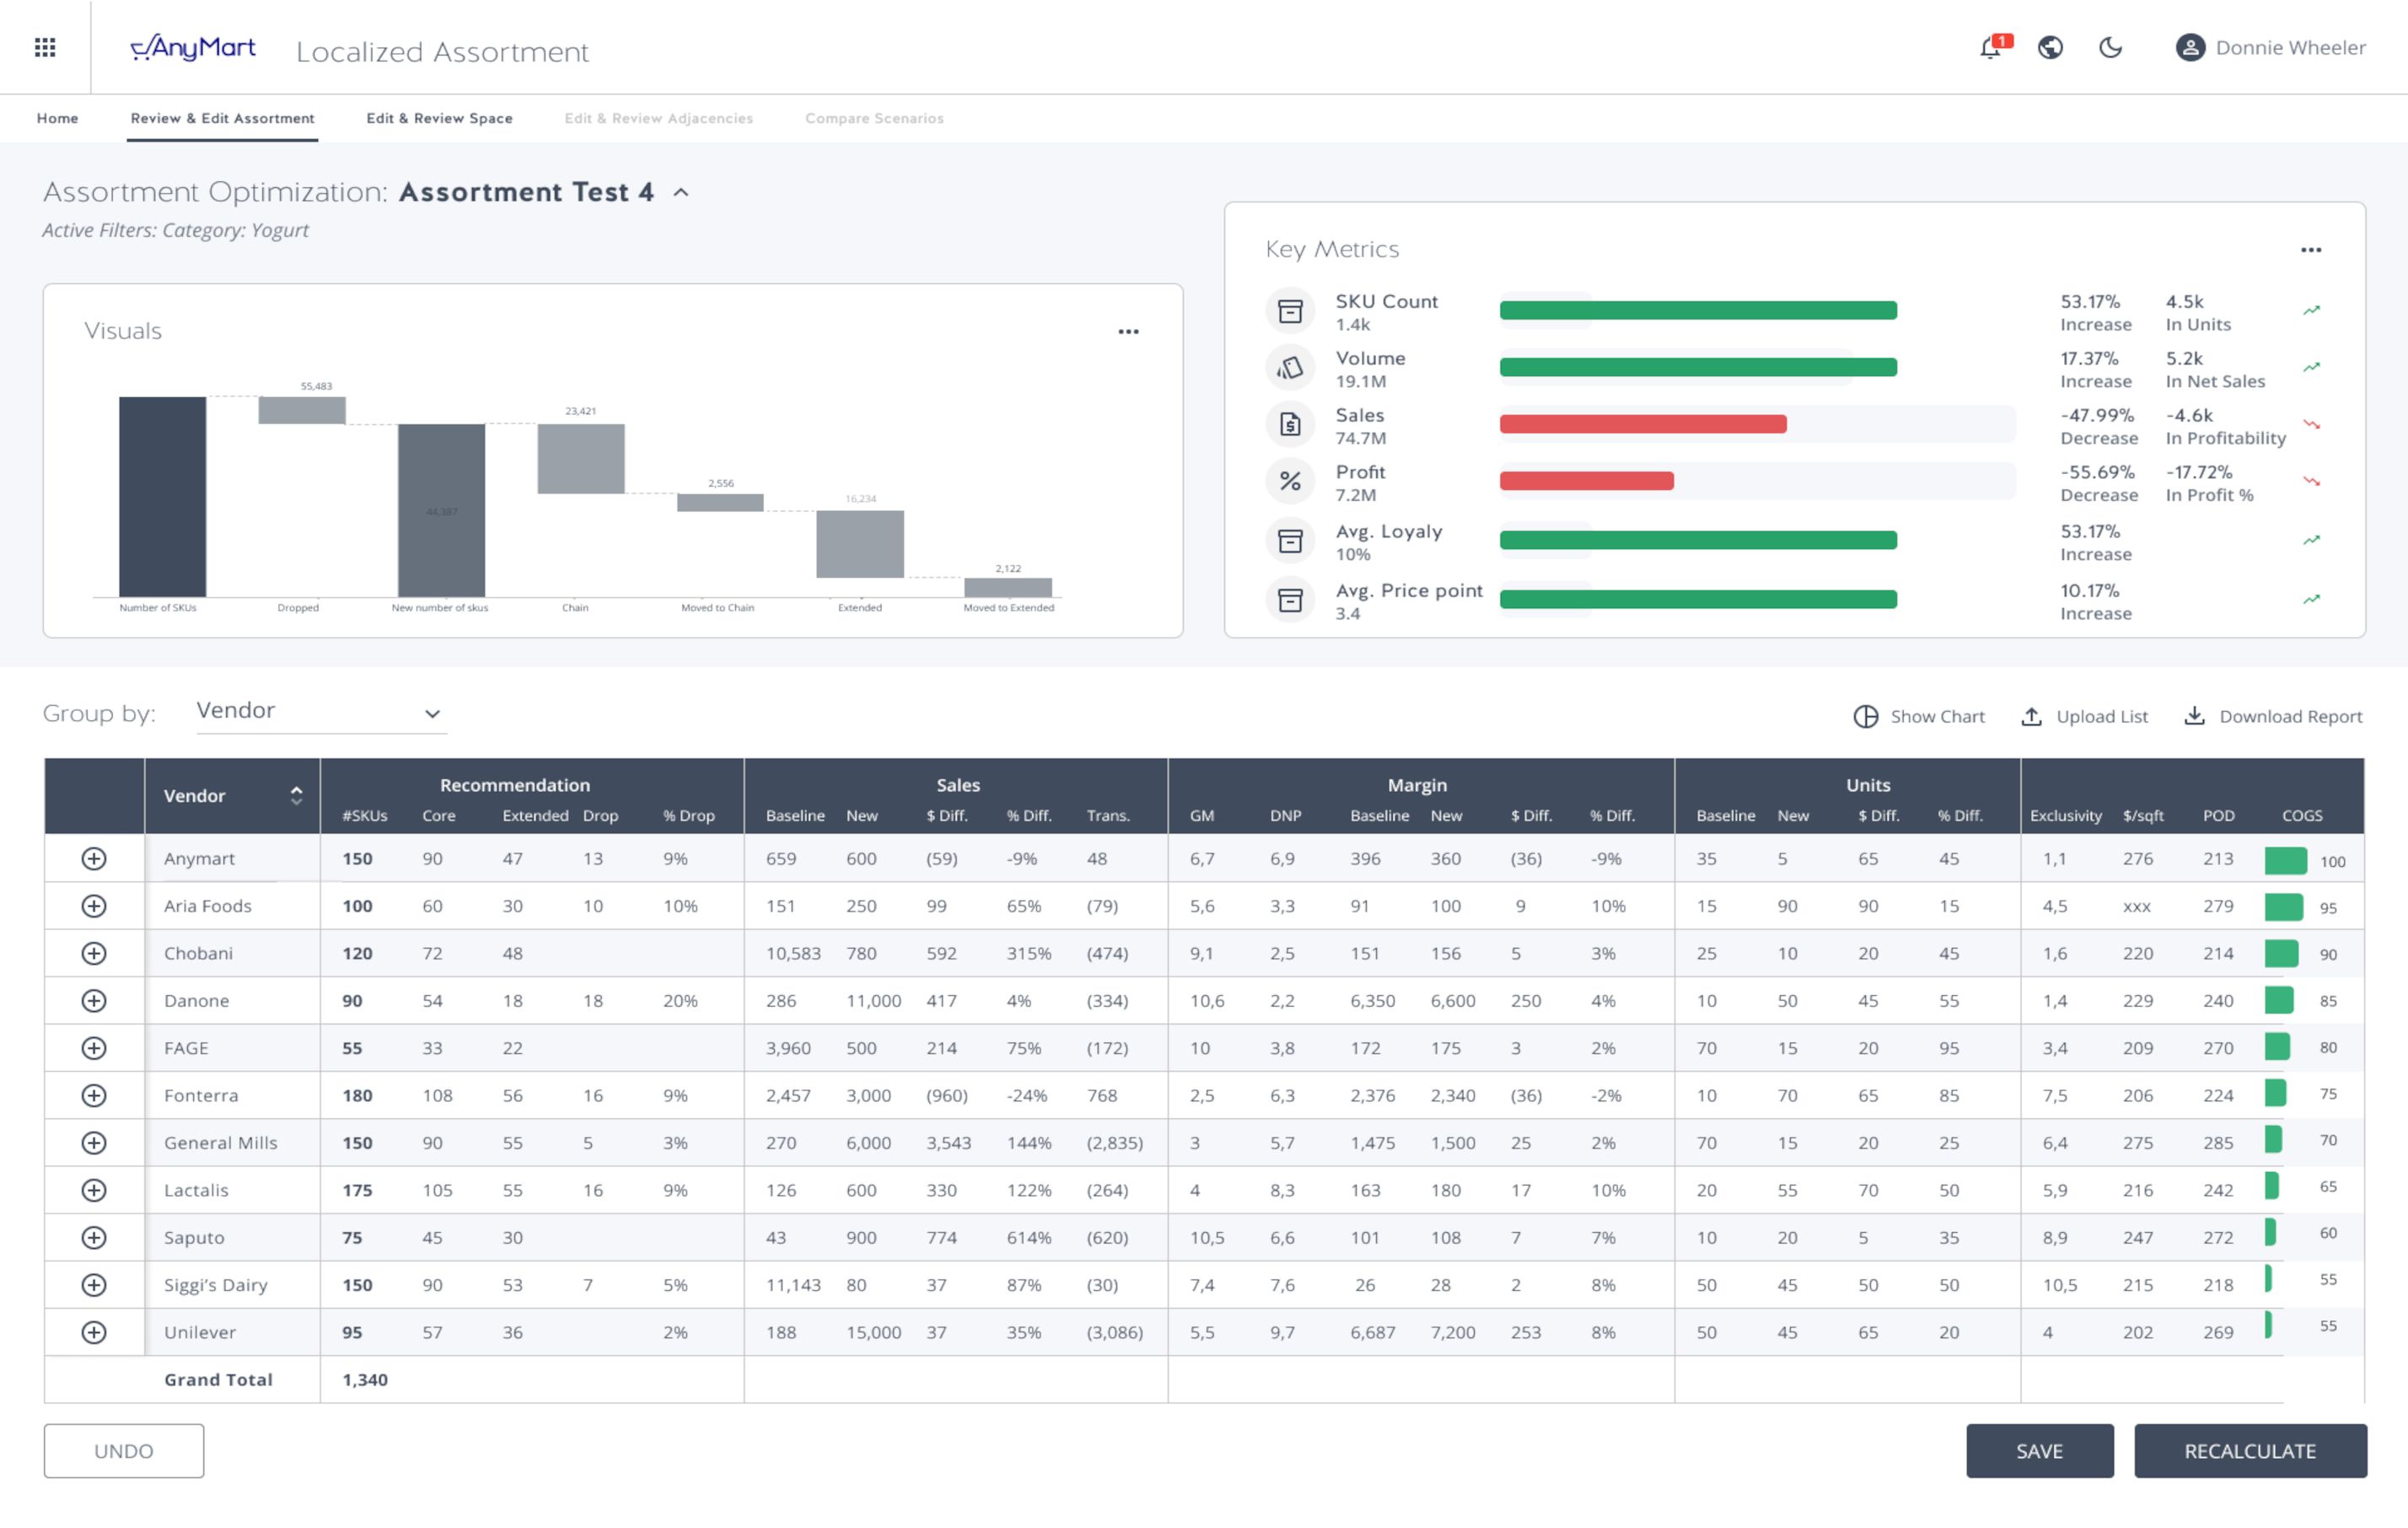
When I first chose React.js for our project, I was an early adopter. The substantial productivity gains I witnessed — such as reusable, composable, testable, and fast components — validated my decision and convinced the BCG team that I'd chosen the right technology. Today, React.js is my go-to JavaScript library when it comes to swiftly building and scaling impressive user interfaces. For our financial projection-based SaaS tool, the combination of React.js and FastAPI provided a wealth of benefits. The component-based architecture of React.js allowed me to efficiently construct complex, interactive user interfaces. It helped me create reusable components, decreasing code repetition and enhancing its readability and maintainability. On the other hand, FastAPI offered a user-friendly, highly scalable, and fast backend, creating the perfect counterpart for my choice of React.js. This powerful combination enabled me to deliver a strong, efficient, and responsive SaaS tool that could handle intricate financial projections while maintaining a seamless user experience.
Algorithmic Innovation
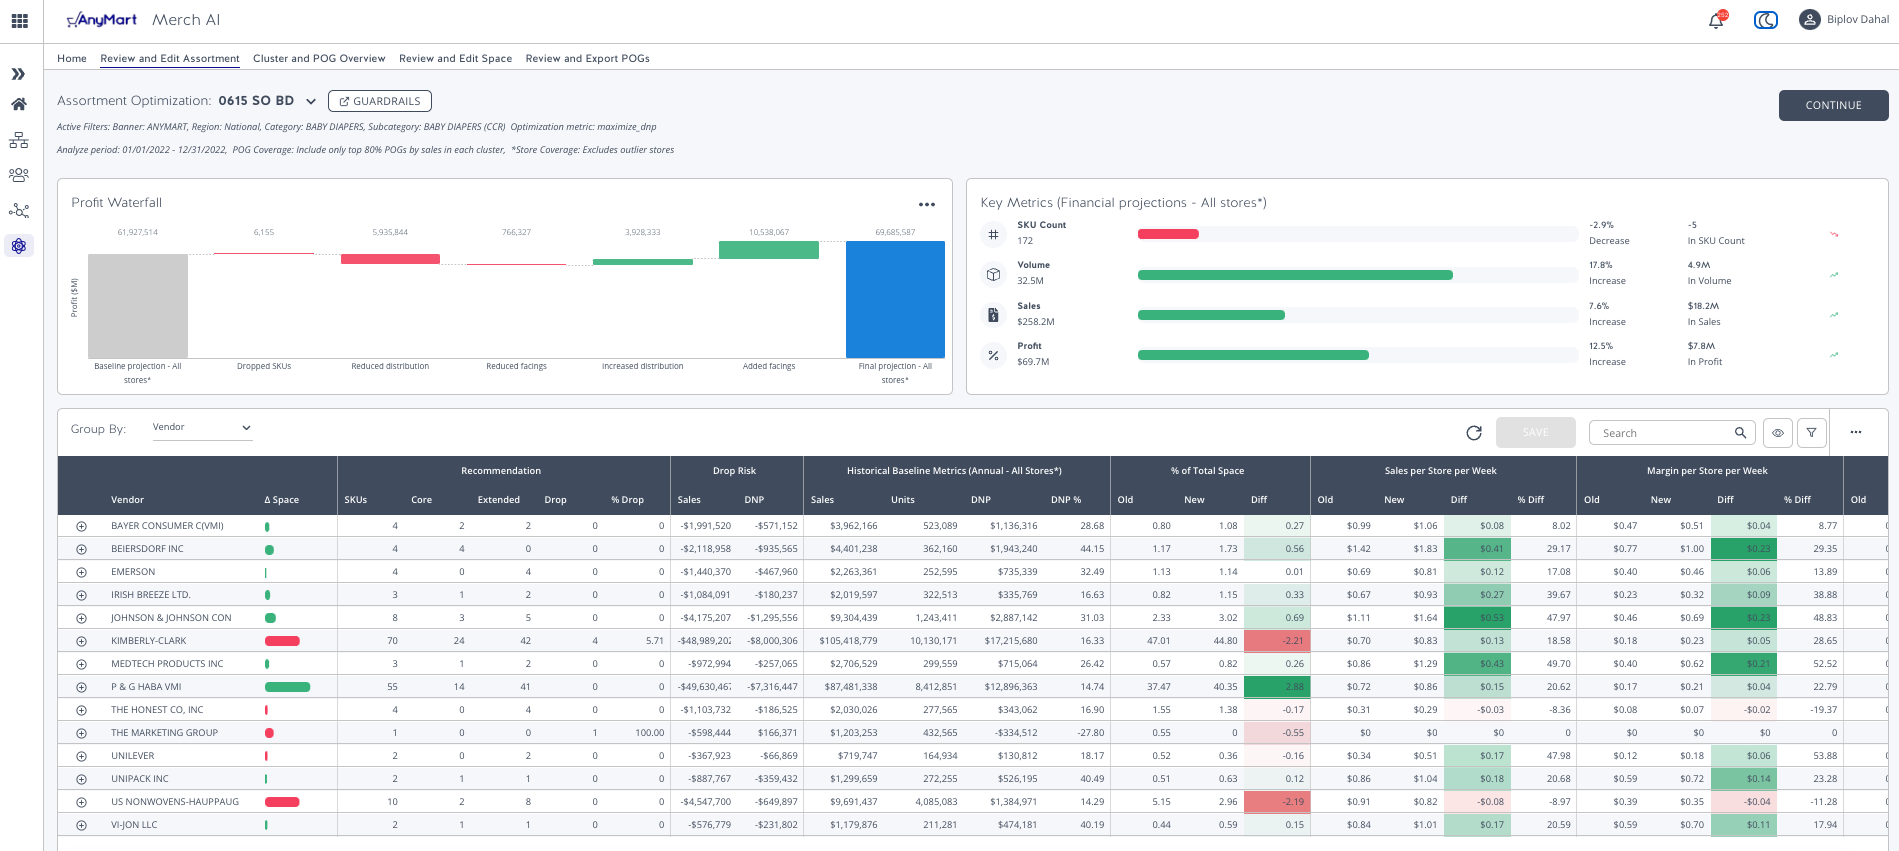
This tool redefines data interpretation with its intuitive interface, simplifying interactions with complex data science processes. Users can effortlessly generate robust data simulations, revealing historical patterns, future projections, and data-driven recommendations.
Decision Tree
Creating a responsive decision tree is difficult as it necessitates developing a versatile and stable structure that can adjust to user selections while managing numerous potential paths. Additionally, the tree should be constructed to facilitate smooth navigation and ensure excellent performance, requiring careful coding and testing.
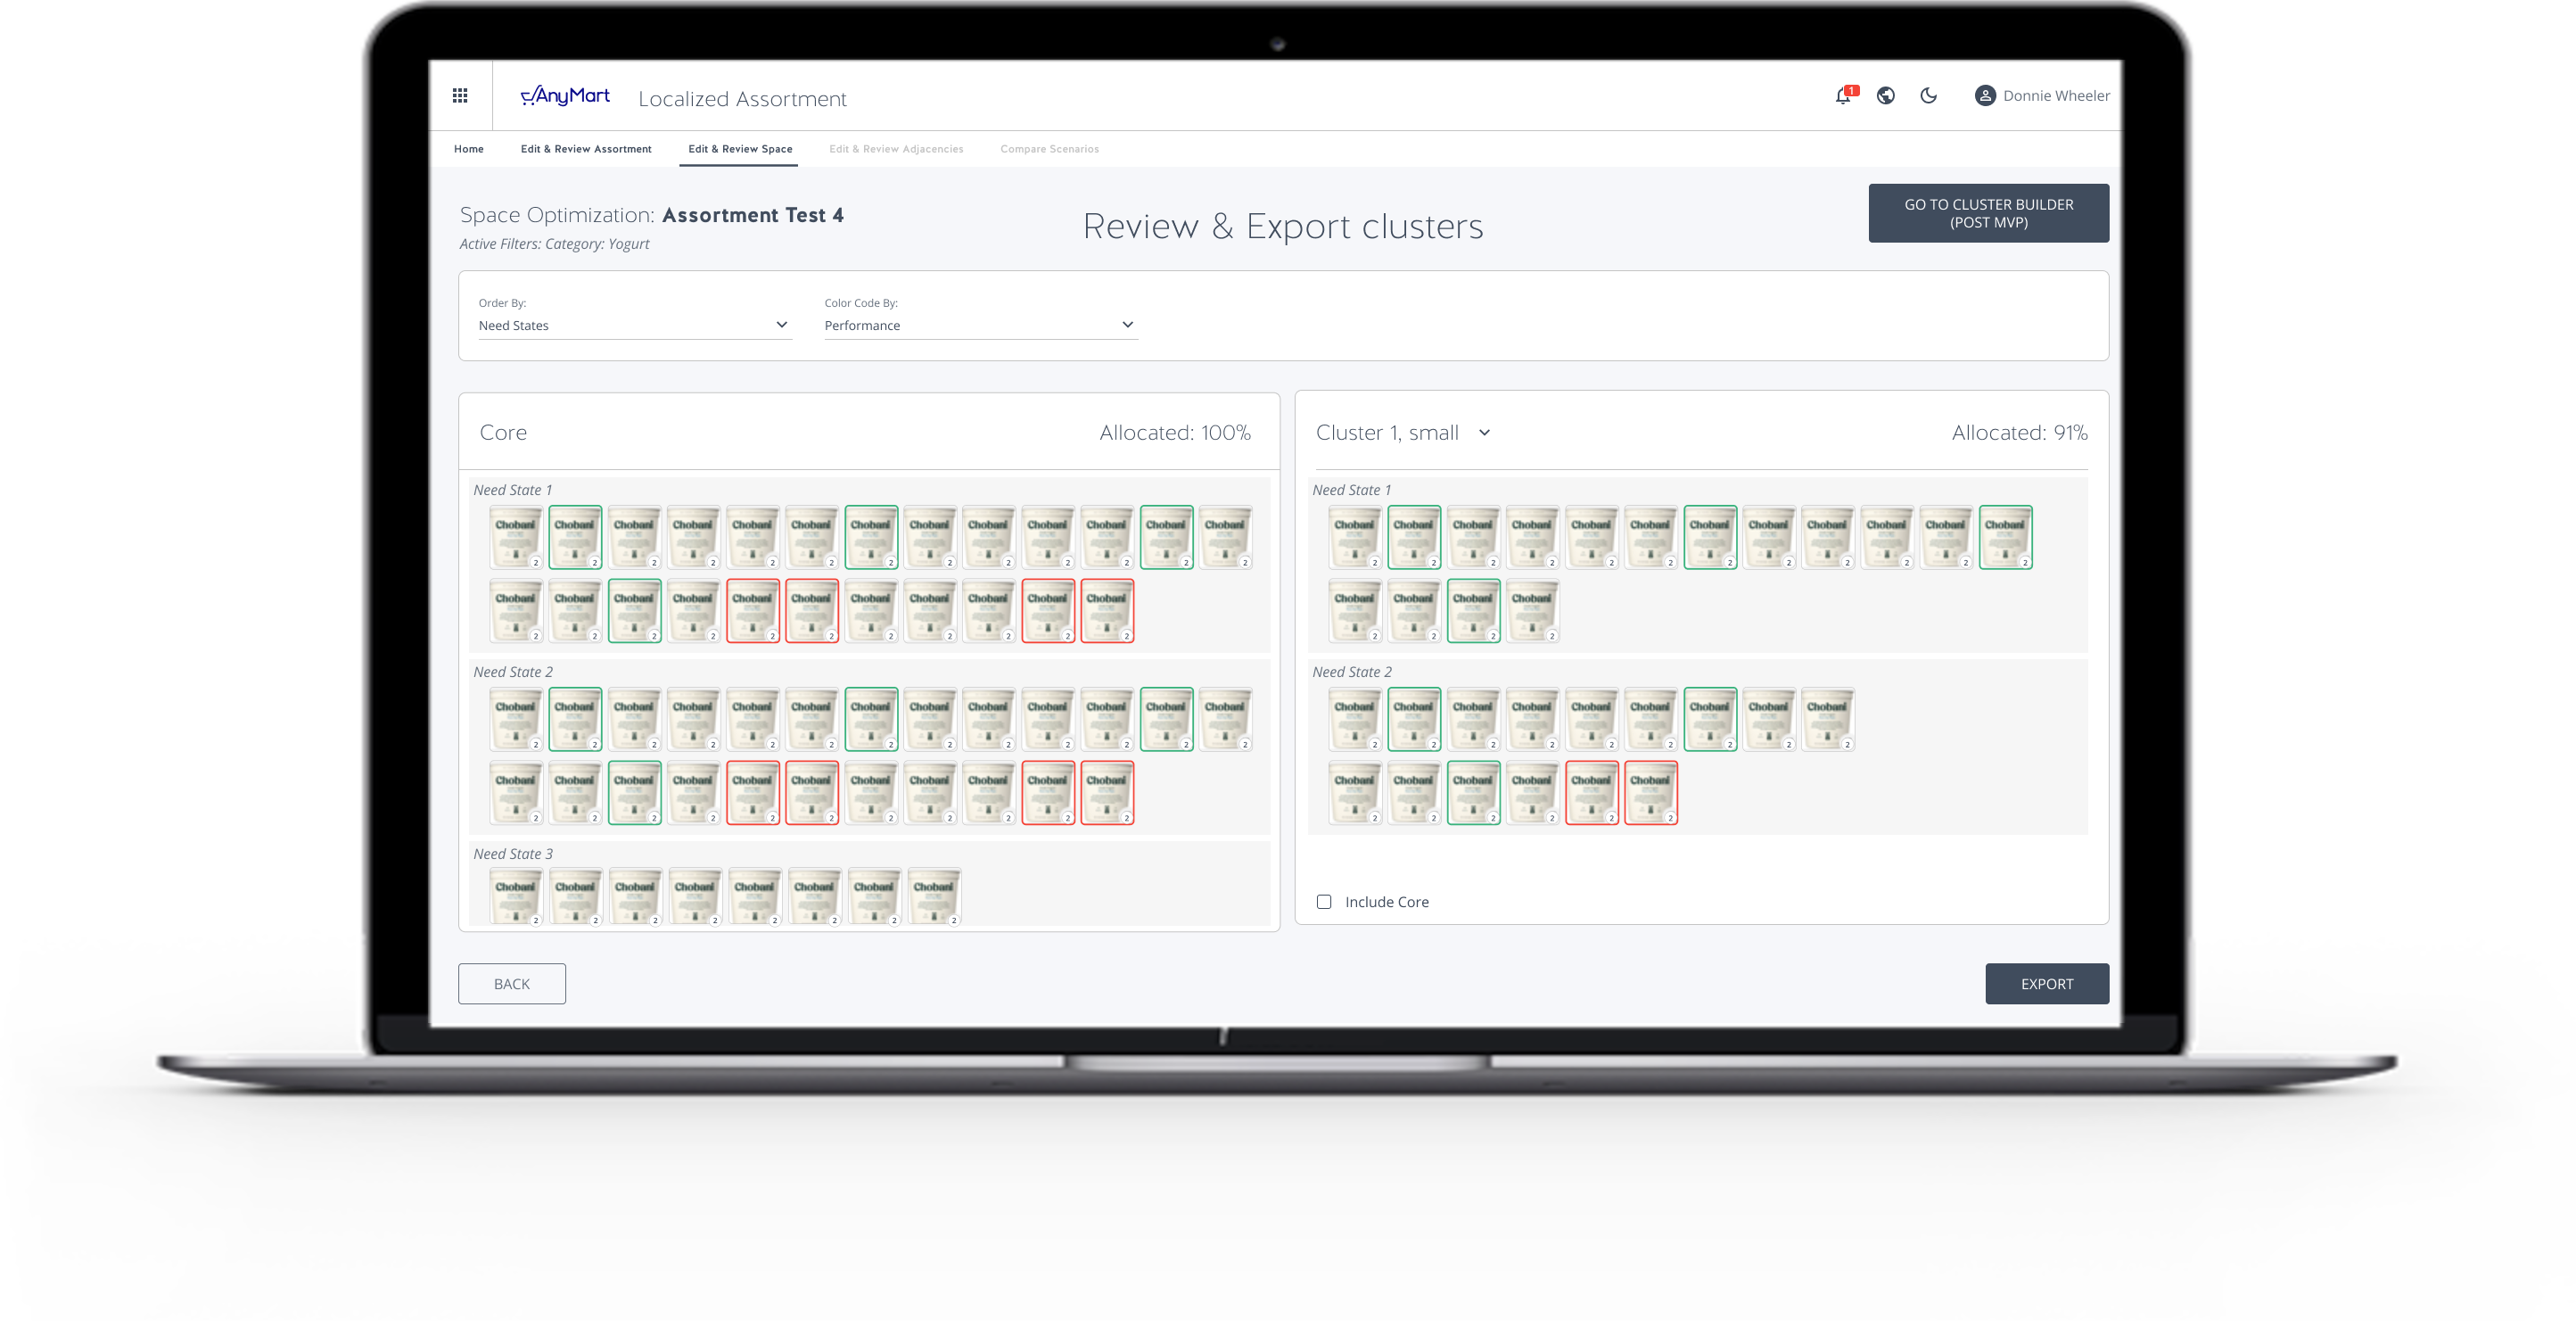
Seamless Interface
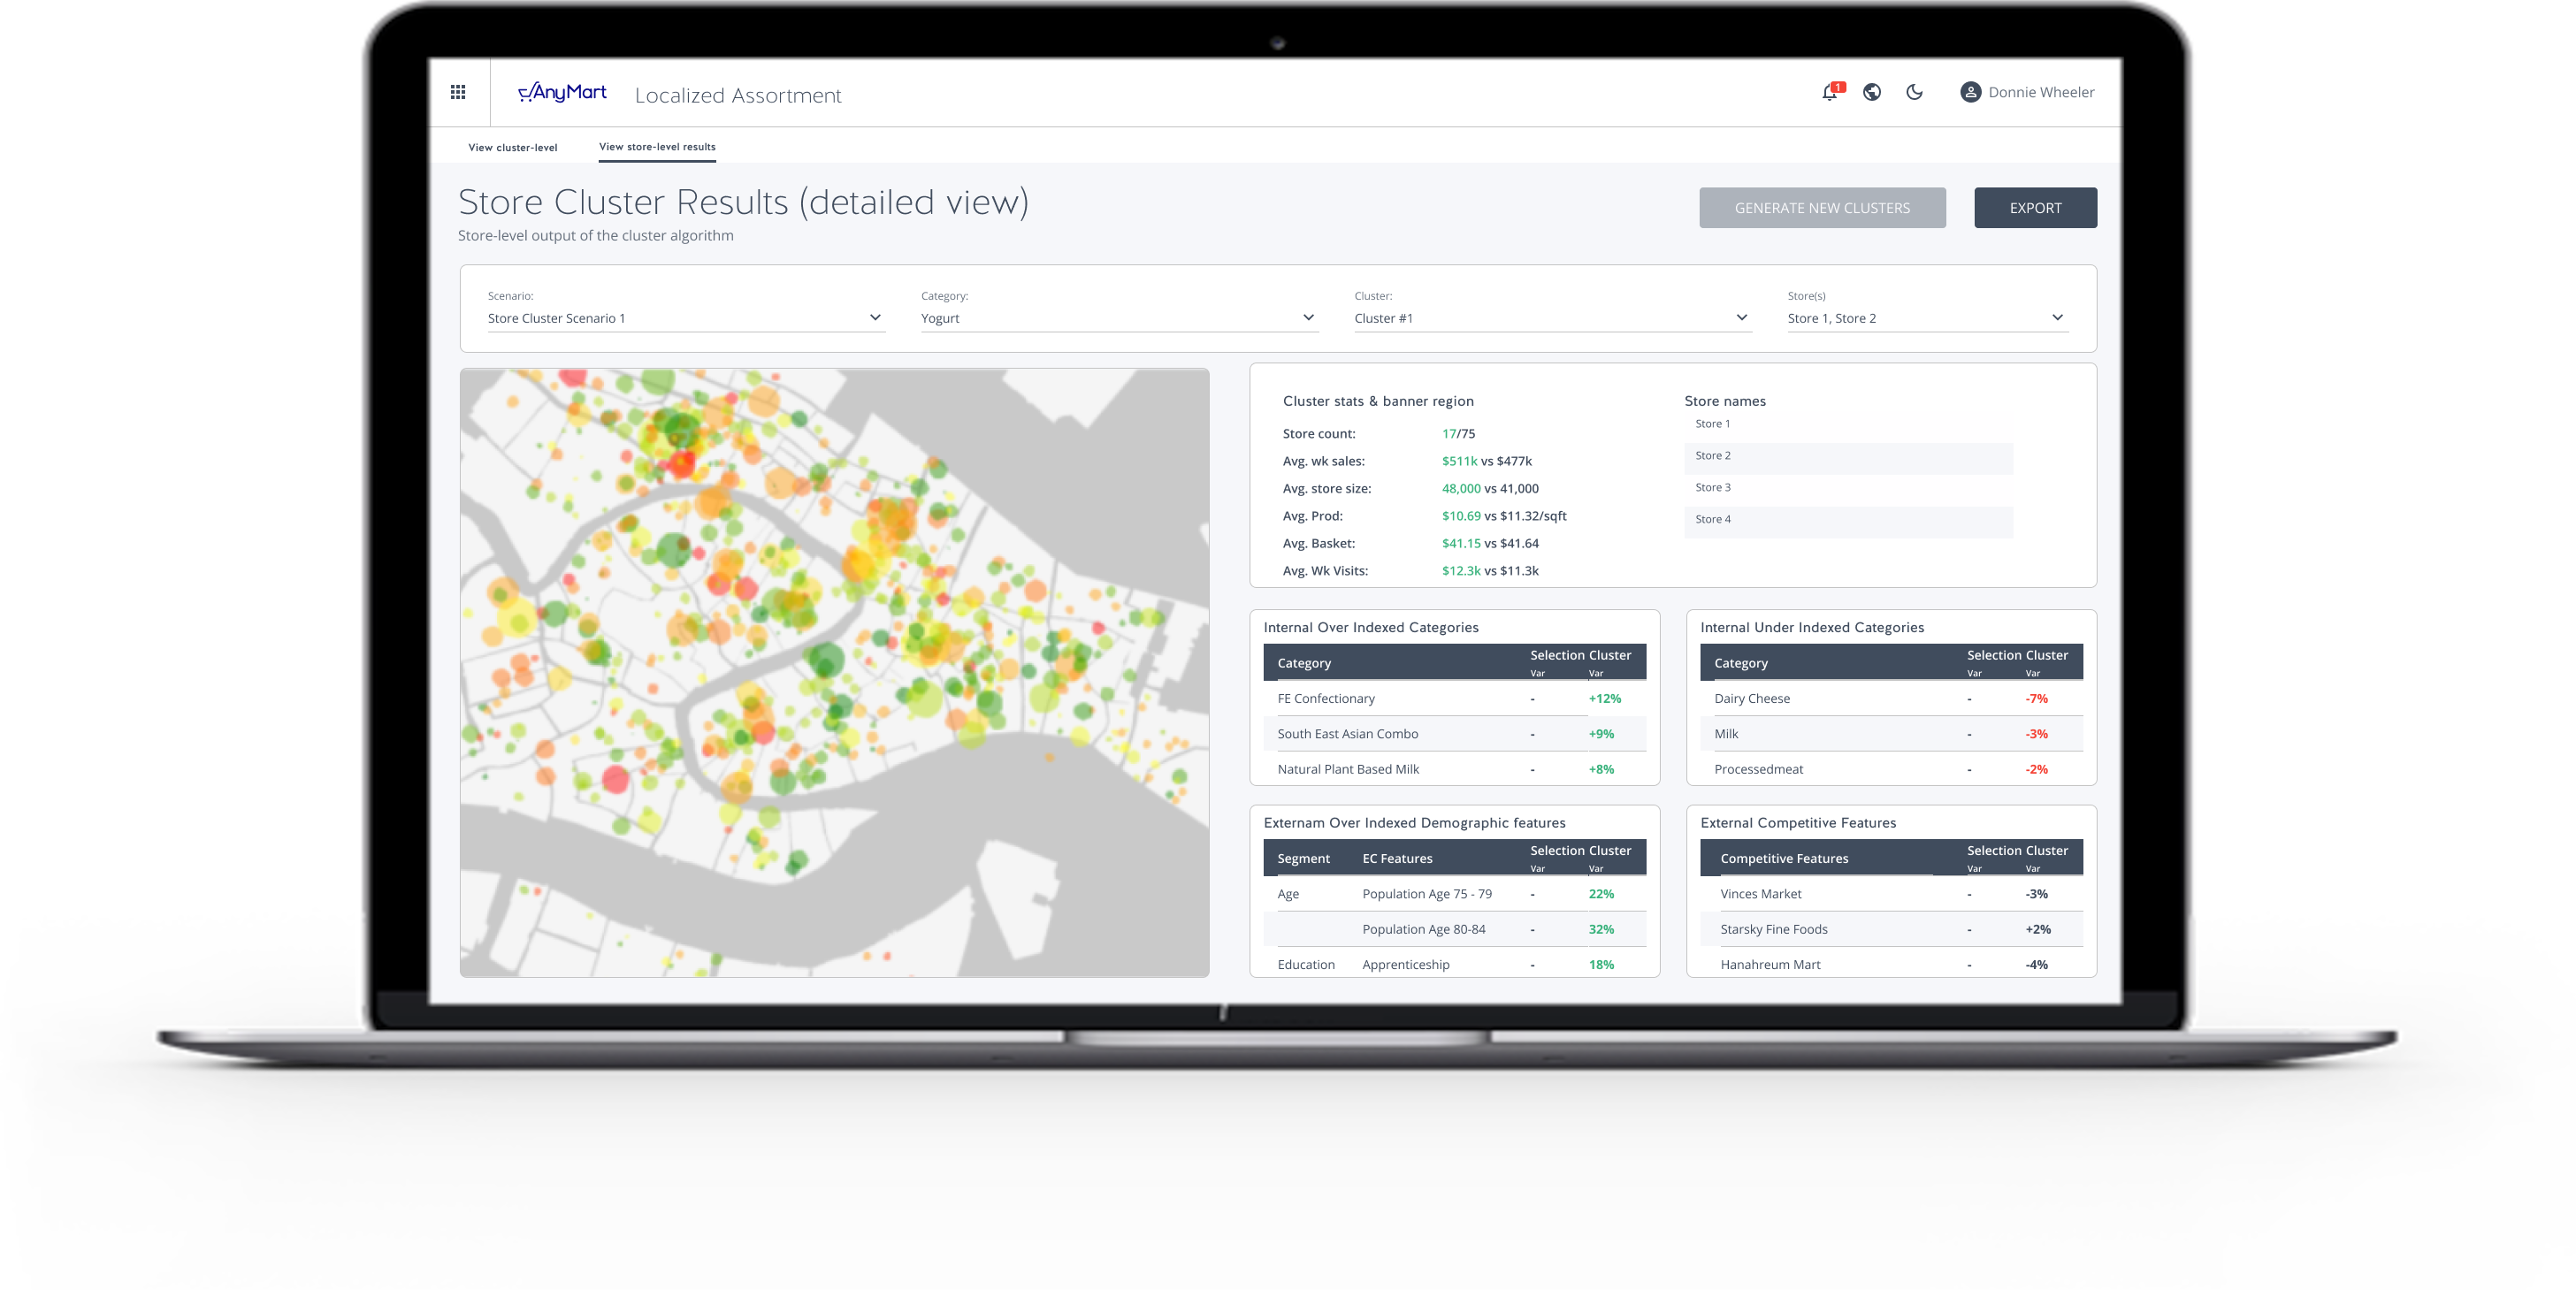
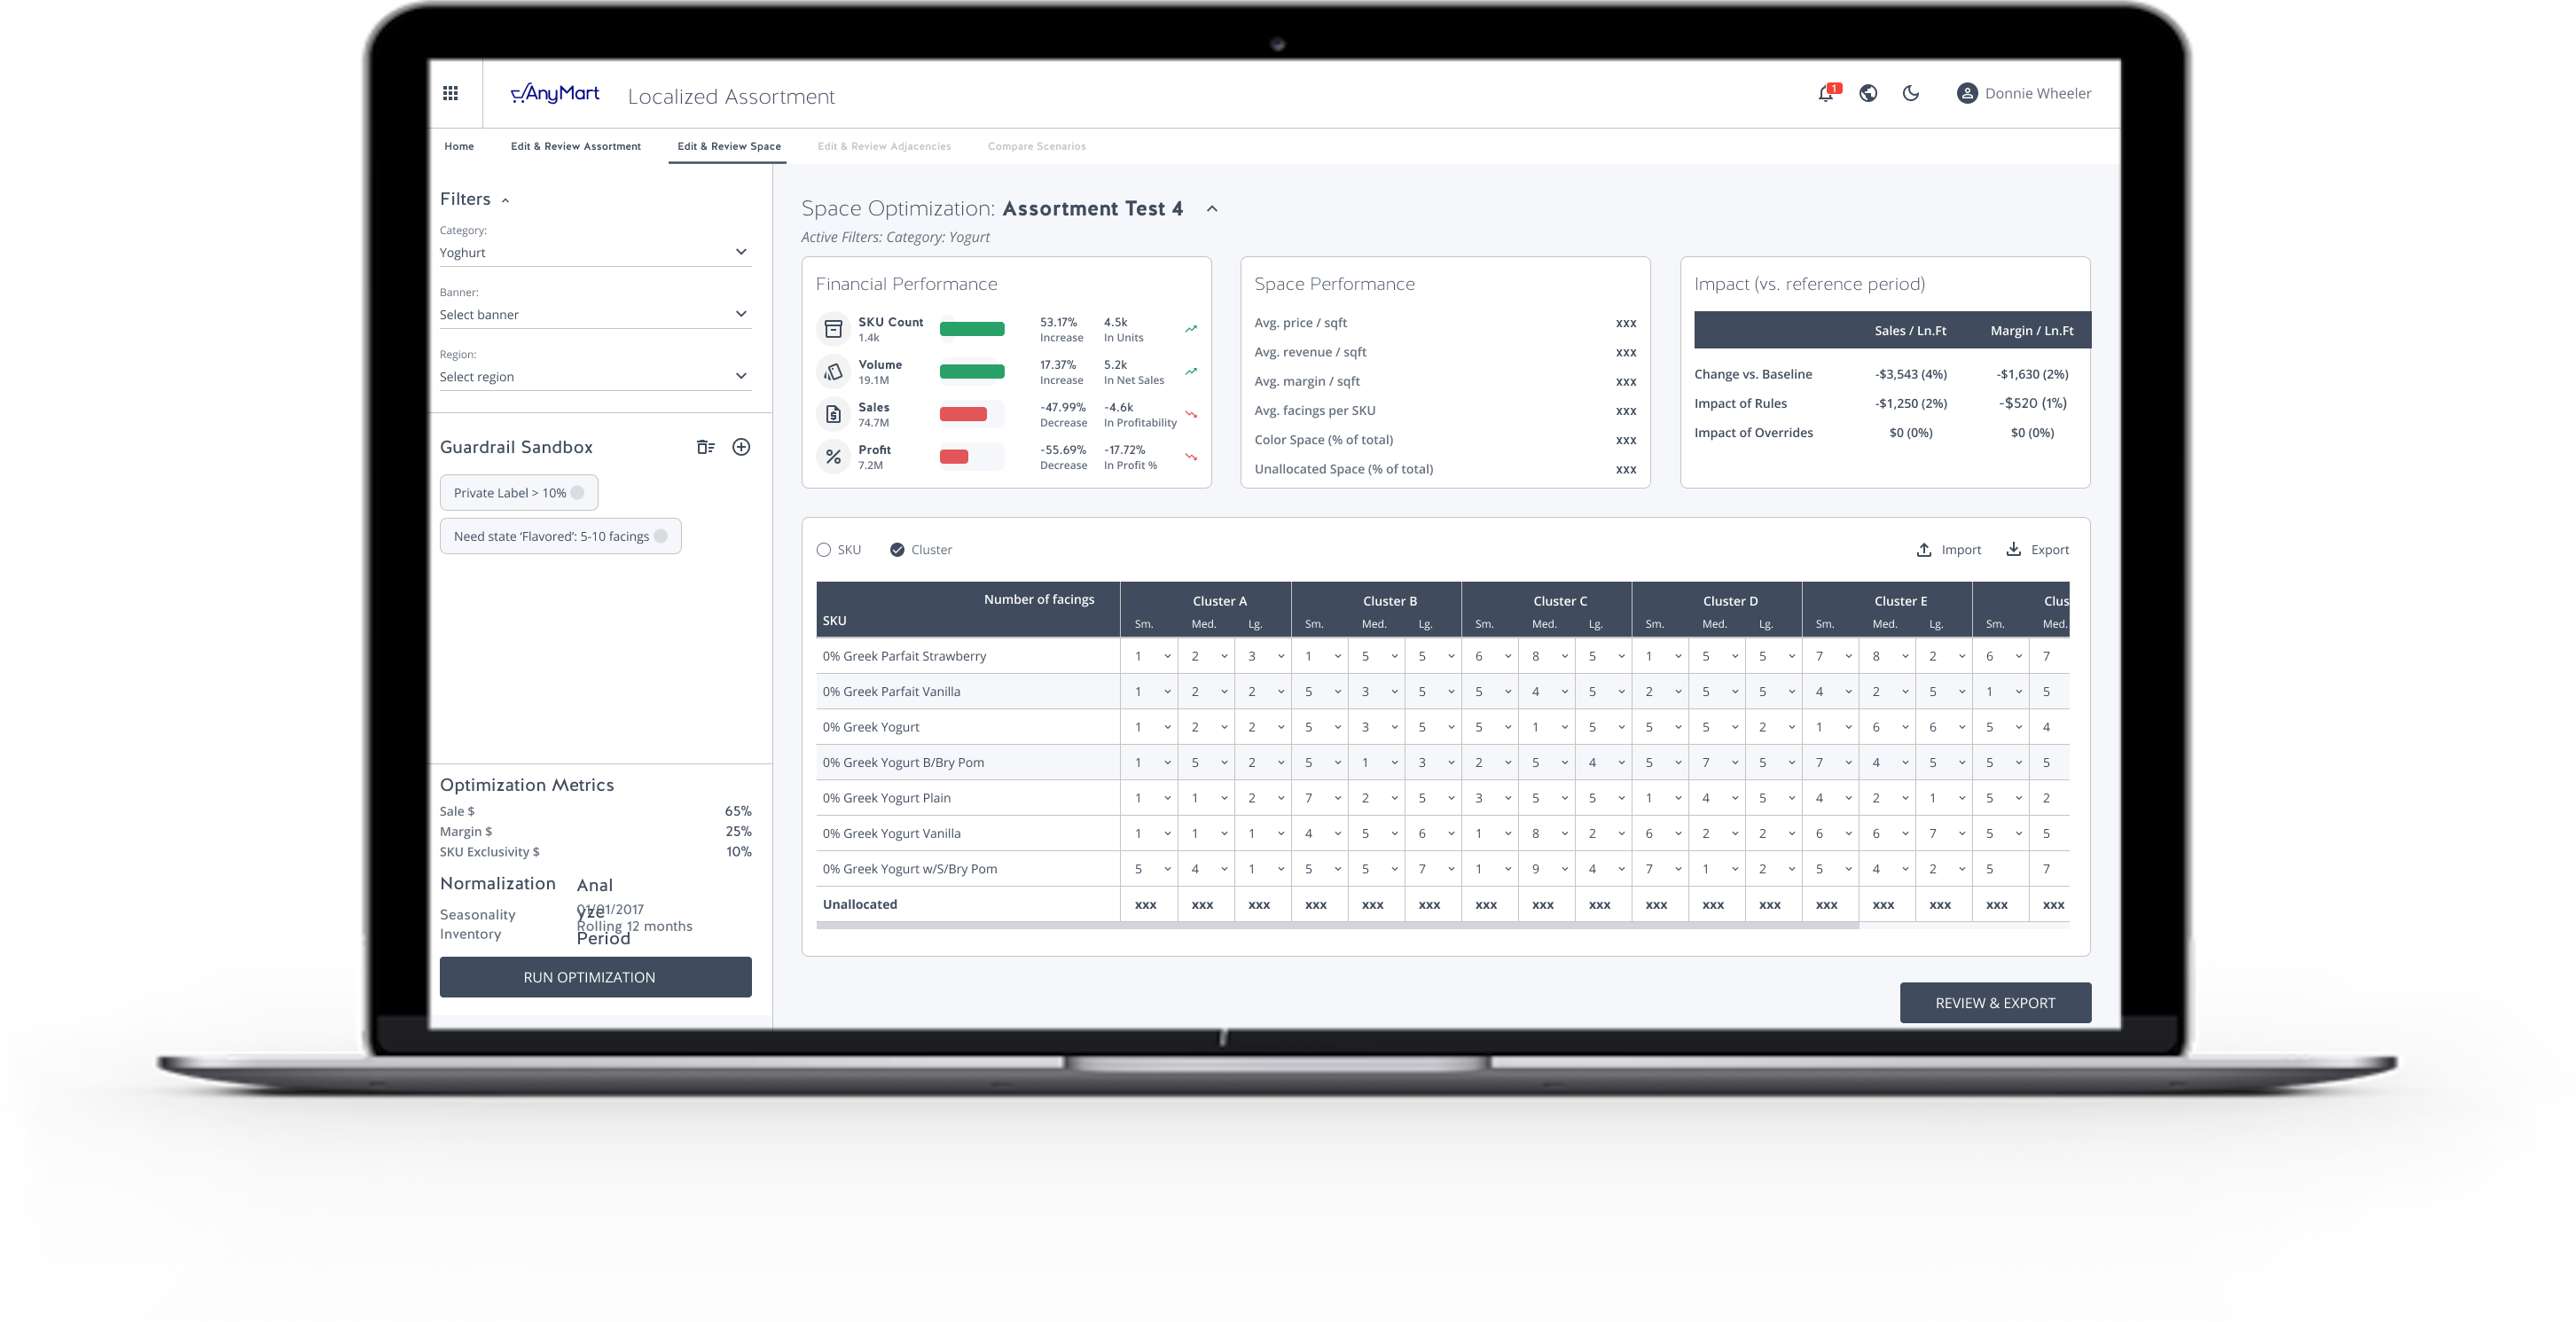
Developed an intricately detailed and robust user interface for Localized Assortment that enables users to intuitively drag and drop items across various components. This interaction is flawlessly facilitated while simultaneously maintaining the application's state in a React environment, ensuring seamless user experiences without disrupting application performance.